Examining Employee Data in mySQL (with a dash of Tableau)
In this post, I discuss a handful of SQL queries on employee data that I’ve implemented in mySQL Workbench. I wrote these queries from scratch, specifically choosing research questions that would require me to write more complex code that I had relatively less experience working with.
Contents
Introductory Information
About the Data
Queries
Average Salary by Month and Year of Hire
Average Salary of Non-Managers by Department and Position
Jobs Held by Those in the Top Salary Decile
Departmental Pay Equality
Youngest and Oldest Employees Ever Hired
Hired or Promoted: How Managers Got the Job
Number of Subordinates Per Manager
Number and Percentage of Staffers Promoted
About the Data
I use data from a fictional employee database available here. The database includes six tables:
- employees: employee number, birth date, hire date, first and last name, gender
- emp_dept: employee number, department number, starting date, ending date
- departments: department number, department name
- dept_manager: department number, employee number, start date, end date
- salaries: employee number, salary, start date, end date
- titles: employee number, title, start date, end date
A visualization of the schema is available here.
Average Salary
I first find the average starting salary offered to employees, grouped by hiring month and year. Because I’ll be searching through the hire_date attribute of the employees table here and in later queries, I go ahead and create an index on it to improve performance. I also split the month and year from hire_date into two distinct attributes.
The subquery in the FROM clause returns a table m with the employee number, their month and year of hire, and their minimum salary. Because the following returns a null set, we know that all changes in a salaries are pay raises. No employee received a pay decrease. Thus, the minimum salary for each employee is their starting salary.
SELECT *
  FROM
     (SELECT e1.emp_no, s1.salary, RANK() OVER(PARTITION BY e1.emp_no ORDER BY salary) AS rnk
        FROM employees e1 JOIN salaries s1 ON e1.emp_no = s1.emp_no) AS t1
       CROSS JOIN
     (SELECT e2.emp_no,s2.salary, RANK() OVER(PARTITION BY e2.emp_no ORDER BY salary) AS rnk
        FROM employees e2 JOIN salaries s2 ON e2.emp_no = s2.emp_no ) AS t2
 WHERE t1.emp_no = t2.emp_no
       AND t2.rnk > t1.rnk
       AND t2.salary < t1.salary ;
From the subquery, we select the number of hires made for each year-month combination, as well as the average starting salary in that month. The results are ordered by hiring year followed by hiring month.
CREATE INDEX idx_hire_date ON employees (hire_date) ;

 ALTER TABLE employees ADD hire_year INT ;
UPDATE employees SET hire_year = (YEAR(employees.hire_date)) ;

 ALTER TABLE employees ADD hire_month INT ;
UPDATE employees SET hire_month = (MONTH(employees.hire_date)) ;

SELECT m.hire_year as 'Hire Year',
       m.hire_month as 'Hire Month',
       COUNT(m.emp_no) as 'Number of Hires',
       ROUND(AVG(m.start_sal), 2) as 'Average Starting Salary'
  FROM
     (SELECT e.emp_no, hire_year,
             hire_month, MIN(salary) AS start_sal
        FROM employees AS e
             INNER JOIN salaries AS s
             ON e.emp_no = s.emp_no
       GROUP BY e.emp_no) AS m
 GROUP BY hire_year, hire_month
 ORDER BY hire_year, hire_month ;
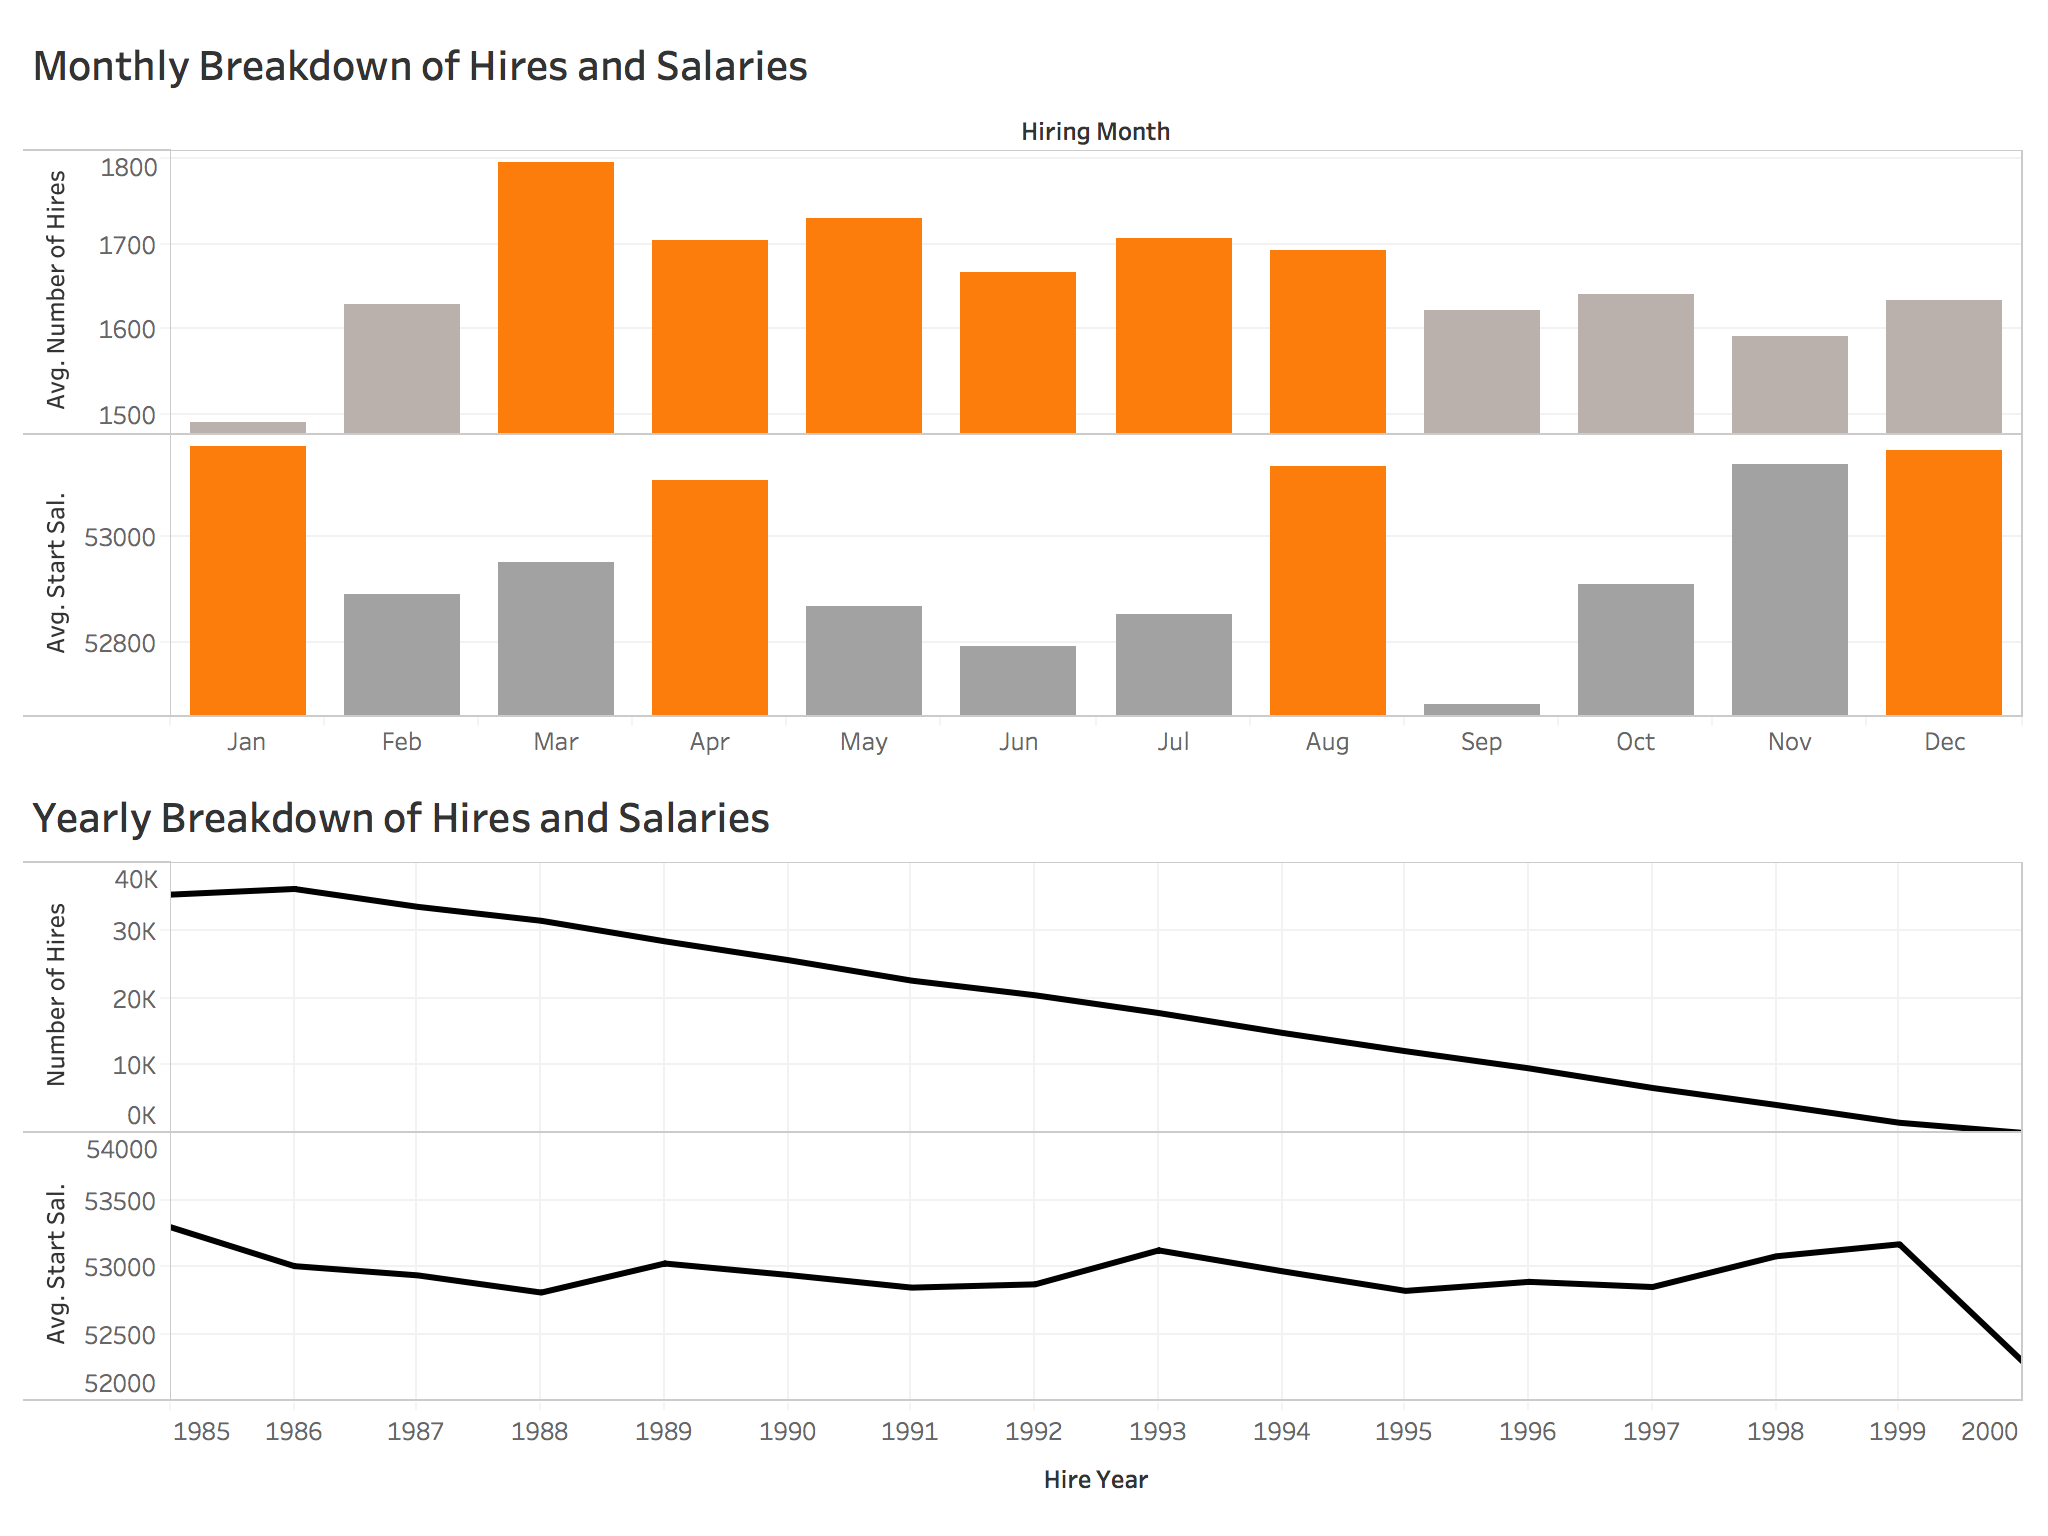
Importing these data into Tableau, we can create a useful dashboard highlighting key insights gleaned from the SQL query. Looking at monthly breakdowns, we see that the average monthly number of hires is highest in the spring and summer months and lower in the fall and winter months. We also see that average starting salaries fluctuate quite noticeably throughout the year. We also see that yearly hiring has linearly decreased over time, and with the exception of 2000, average starting salaries by year remained relatively constant. However, it should be noted that I have truncated y-axes on several the charts to highlight seasonal differences. In doing so, the differences appear larger visually than they are in reality. Nevertheless, with this in mind, we see some clear monthly seasonility in hiring practices.
Non-Managerial Salary
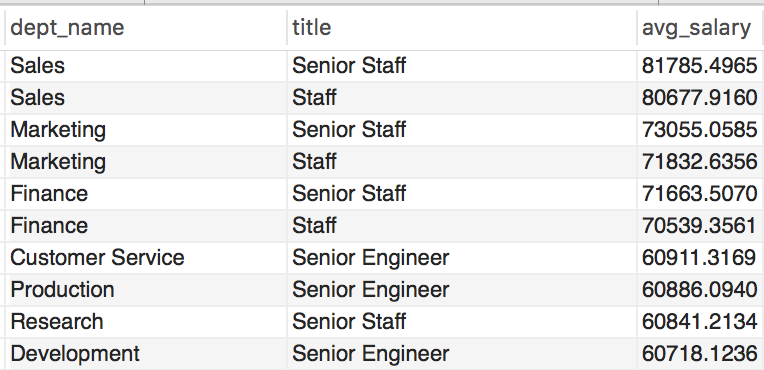
Next, I endeavor to find the average salary of all non-managers broken down by department and position title. The following query provides just that.
SELECT dept_name,
       title,
       AVG(salary) AS avg_salary
  FROM salaries AS s
       INNER JOIN dept_emp AS de
       ON s.emp_no = de.emp_no

       INNER JOIN departments AS d
       ON de.dept_no = d.dept_no

       INNER JOIN titles AS t
       ON s.emp_no = t.emp_no
 WHERE title NOT IN
                 (SELECT title
                    FROM titles
                   WHERE title = 'Manager')
 GROUP BY dept_name, title
 ORDER BY avg_salary DESC ;
A snapshot of the top 10 results shows the following. Perhaps unsurprisingly, salespeople, followed by those in marketing and finance, bring in the highest salaries on average.
High Paying Jobs
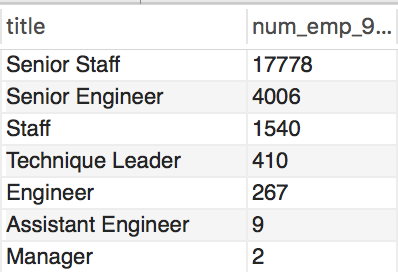
The following query returns a count of the number of people in the top 10% of salary, by title. We see that the top decile is made up largely of senior staffers.
SELECT title,
       COUNT(p.salary) as num_emp_90p
  FROM
      (SELECT title,
              salary,
              RANK() OVER (ORDER BY salary DESC) as sal_rank
         FROM employees AS e
              INNER JOIN salaries AS s
              ON e.emp_no = s.emp_no

              INNER JOIN titles AS t
              ON e.emp_no = t.emp_no
	WHERE s.to_date = '9999-01-01' AND   -- '9999-01-01' in the end date indicates current position
              t.to_date = '9999-01-01') AS p
 WHERE p.sal_rank <= .1 * 240124   -- 240124 is the total number of current employees
 GROUP BY title
 ORDER BY num_emp_90p DESC ;
Pay Equality
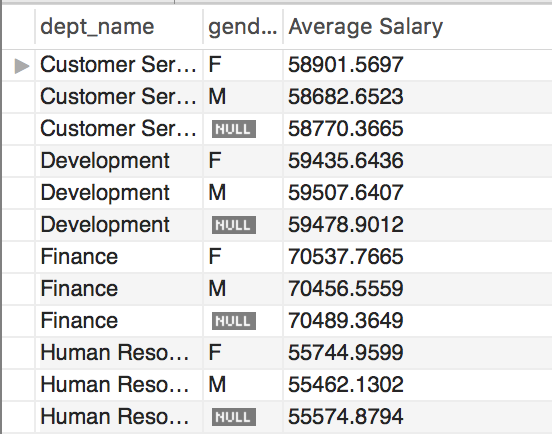
Next, I look at departmental pay inequality by gender. Using WITH ROLLUP provides the mean average salary for men and women in each department, combined with the average salary for both genders in the department. I find that there is little to no pay gap by gender within departments.
SELECT dept_name,
       gender,
       AVG(salary) as 'Average Salary'
  FROM employees AS e
       INNER JOIN dept_emp AS de
       ON e.emp_no = de.emp_no

       INNER JOIN departments AS d
       ON de.dept_no = d.dept_no

       INNER JOIN salaries AS s
       ON e.emp_no = s.emp_no
 GROUP BY dept_name, gender WITH ROLLUP ;
Youngest and Oldest Employees Hired
I also find the oldest and youngest employees ever hired by the company. The following query finds that the youngest employee ever hired was 20 years old, while the oldest employee was 47 years old.
(SELECT 'Youngest Hire' AS Description,
        first_name,
        last_name,
        hire_date,
        birth_date,
        DATEDIFF(hire_date, birth_date) / 365.25 AS hire_age
   FROM employees
  ORDER BY hire_age
  LIMIT 1)
UNION
(SELECT 'Oldest Hire' AS Description,
        first_name,
        last_name,
        hire_date,
        birth_date,
        DATEDIFF(hire_date, birth_date) / 365.25 AS hire_age
   FROM employees
  ORDER BY hire_age DESC
  LIMIT 1) ;
Hired or Promoted
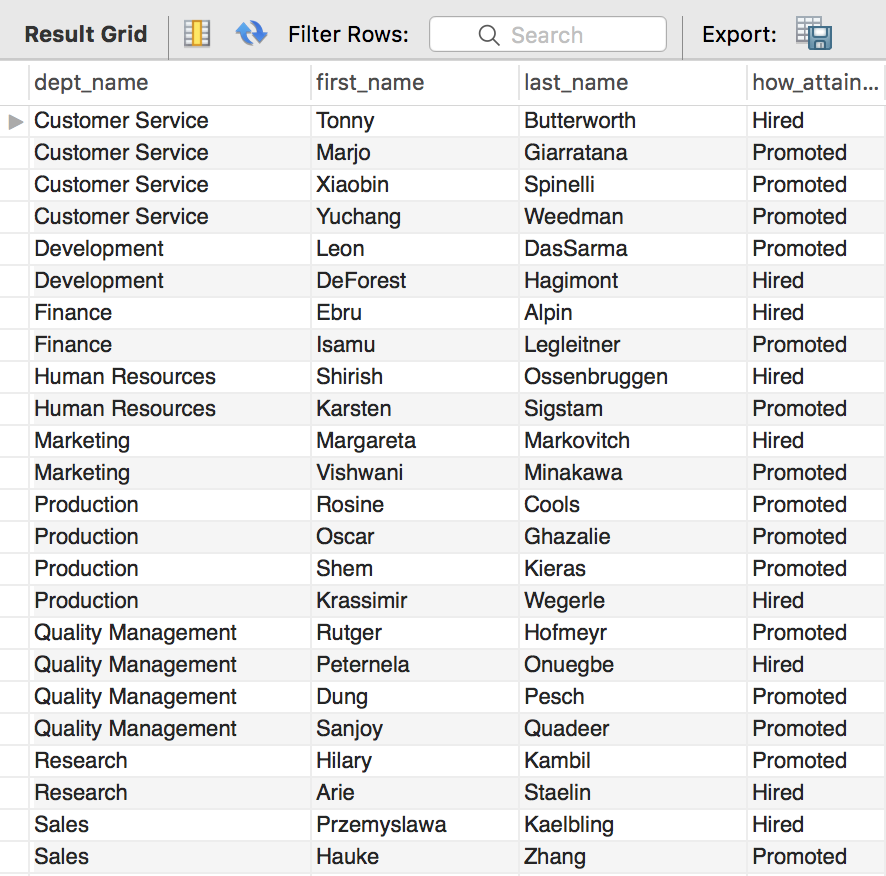
Next, I was interested in investigating promotional opportunities available to employees. The following returns a list of all managers and information whether they were hired as a manager or promoted to the position. We find that most managers achieve the position through promotion.
SELECT dept_name,
       first_name,
       last_name,
       CASE WHEN dm.from_date = e.hire_date
            THEN 'Hired'
            ELSE 'Promoted'
	    END AS how_attained
  FROM dept_manager dm
       INNER JOIN employees AS e
       ON dm.emp_no = e.emp_no

       INNER JOIN departments AS d
       ON dm.dept_no = d.dept_no
 ORDER BY dept_name, last_name, how_attained ;
Number of Subordinates
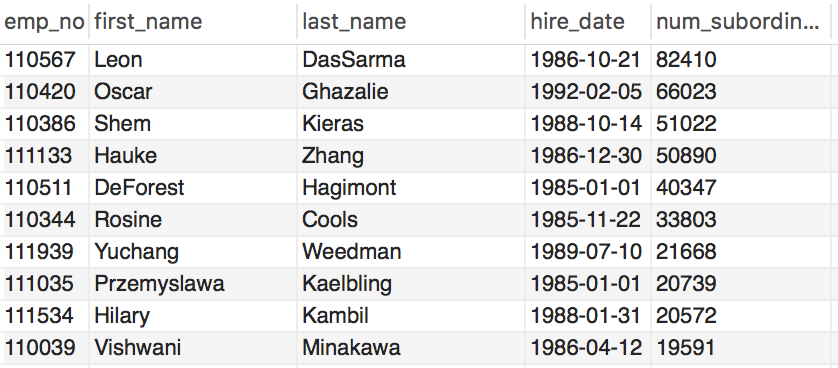
I also examine the number of subordiantes each manager has hired. We see a wide range, with the top manager having managed over 80,000 employees.
SELECT e.emp_no,
       e.first_name,
       e.last_name,
       e.hire_date,
       ct.num_subordinates
  FROM employees AS e
       INNER JOIN
           (SELECT dm.emp_no,
                   COUNT(de.emp_no) as num_subordinates
              FROM dept_emp AS de, dept_manager AS dm
             WHERE de.dept_no = dm.dept_no AND
                   (dm.from_date <= de.from_date AND dm.to_date >= de.from_date OR
                   dm.from_date BETWEEN de.from_date AND de.to_date)
             GROUP BY dm.emp_no) AS ct
       ON e.emp_no = ct.emp_no
 ORDER BY num_subordinates DESC ;
Promoted Staffers
Lastly, I find that around half of the individuals hired as staffers are eventually promoted to senior positions:
SELECT DISTINCT title FROM titles ;

SELECT 'Promoted Staffers' AS description,
       COUNT(ps.emp_no) AS num_promoted,
       (SELECT COUNT(ps.emp_no)) / (SELECT COUNT(ts.emp_no)
                                      FROM
                                          (SELECT DISTINCT t.emp_no
                                             FROM titles AS t
                                                  INNER JOIN employees AS e
                                                  ON t.emp_no = e.emp_no
                                            WHERE title LIKE '%staff%') AS ts) AS pct_promoted
  FROM
     (SELECT t.emp_no,
             COUNT(title) as num_pos
        FROM titles AS t
       WHERE title LIKE '%staff%'
       GROUP BY t.emp_no
      HAVING num_pos >= 2) AS ps ;

Updated on October 1, 2018
